HOW are we performing?
As part of our sustainability initiative, Ameren has sought to assess our performance—what we’re doing well and what we can do better. Members of Ameren’s internal corporate social responsibility Steering Committee collaborated to consider enterprise-level categories, areas of success and areas for improvement. Additional guidance was provided by our Executive Leadership Team and subject-matter experts. In this area, we asked, “Has Ameren provided sufficient returns to shareholders?” Our assessment is current through March 1, 2017.
| Priorities | Successes | Opportunities | |
|---|---|---|---|
|
Attractive, predictable returns |
Allocating capital to growth opportunities that are under modern, constructive regulatory frameworks that provide an opportunity to achieve fair returns for investors. Achieving a total shareholder return of 63% over the three-year period from Dec. 31, 2013, through Dec. 31, 2016. Continuing 100-plus years of uninterrupted cash dividends. |
Sustaining total shareholder return performance relative to our peers over the long term. | |
|
Earnings and dividend growth |
Growing core earnings per share 28% since 2013. Projecting 5% to 8% compound annual earnings per share growth from 2016 through 2021.* Increasing the dividend rate 3.5% in 2016. |
Achieving consistent earnings and dividend growth over a sustained period. | |
|
Solid financial management |
Improving Ameren’s credit metrics that support our credit ratings by controlling costs and effectively managing business risk, enabling Ameren to access debt at competitive rates. Managing our business consistent with existing regulatory frameworks. |
Continuing to focus on opportunities related to the principles of LEAN, a system for continuous process improvement. | |
* Based on adjusted 2016 EPS guidance midpoint of $2.63 provided Feb. 19, 2016. Issued and effective as of Feb. 16, 2017, earnings call. |
|||
2016 Market Price: Common Stock
41.50
Low
54.08
High
52.46
Year End
Annualized Dividend
10
Since 2013
Core Earnings Per Diluted Share
28
Since 2013
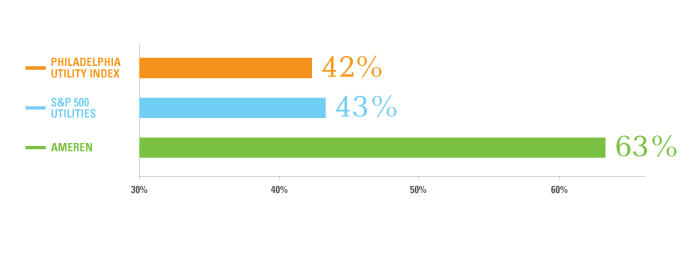
Outperforming our Peers
Three-Year Total Cumulative Shareholder Return (12.31.13 through 12.31.16)
GAAP to Core Earnings Reconciliations
-
- 2013
- 2014
- 2015
- 2016
GAAP earnings per diluted share
-
- 1.18
- 2.40
- 2.59
- 2.68
Exclude results from discontinued operations
-
- 0.92
- —
- (0.21)
- —
Exclude provision for discontinuing pursuit of a license for a second nuclear unit at the Callaway Energy Center (included in continuing operations)
-
- —
- —
- 0.18
- —
Core earnings per diluted share
-
- 2.10
- 2.40
- 2.56
- 2.68